


Reviews and corrects ledger-to-subledger alignment in D365 by fixing posting configurations, inventory profiles, reconciliation logic, GL mapping, and critical reporting procedures.
Overview of Financial Reporting with Microsoft Dynamics 365 Finance
Posted on: April 16, 2024 | By: Jarrod Kraemer | Microsoft Dynamics AX/365, Microsoft Dynamics Manufacturing
Navigating and leveraging financial reports within Microsoft Dynamics 365 Finance can help you better understand and manage your business’ fiscal health. This guide will help you understand the functionalities available for viewing, dissecting, and customizing financial reports to meet their specific needs. Starting with the basics of opening a report, the guide delves into how to drill down for more detailed analysis, adjust report options for tailored insights, and the processes for updating, publishing, and displaying reports in alternative currencies. It also covers how to streamline reports for a summarized view, the steps for printing, and the procedures for exporting reports to Microsoft Excel for more edits.

Step 1: Accessing a Financial Report
To get started, simply select the desired report name. When opening a report for the first time, it will automatically generate data for the previous month. For instance, if you open a report in April 2024, it will display data as of March 31, 2024. Once the report is open, you can explore the data by drilling down into specific areas and adjusting report options.
Step 2: Navigating Through Report Levels
Financial reports often include multiple levels of detail. The financial level is the first level you’ll see upon opening a report. To access the account level, simply select the data you wish to examine further. For example, to view account details for sales, click on the relevant sales data.
From the account level, you can drill down to view the transactions that comprise the account balance. There are two ways to do this:
- Report transactions: View transactions in a formatted view within the financial report by selecting the data and clicking “Drill to report transaction level.”
- Voucher transactions: Open a voucher transaction inquiry to view transactions by selecting the data and clicking “Open account transactions.”
If you’re examining budget data, you can choose to open budget account entries. To return to the starting point, simply press the Esc key or click the Close button (X) in the upper right corner.
Step 3: Customizing Report Options
To tailor the report to your needs, you can apply attribute and dimension filters or change the budget scenario on an Actual versus budget report. On the Action Pane, click “Report options” and follow these steps:
- Apply attribute filters by selecting “Add an attribute filter,” choosing the attribute, entering the attribute value, and clicking OK.
- Apply dimension filters by selecting “Add a dimension filter,” choosing the dimension, and entering the dimension ID or selecting it from the list.
Change the scenario on an Actual versus budget report by selecting a new scenario and clicking OK. Note that if the selected scenario is for a different fiscal year, no results will be returned. Click ‘OK’ to apply the selected options or ‘Cancel’ to discard them.
To ensure your financial report reflects the most current data, click “Refresh” on the Action Pane. The updated report will only be visible to the person who updated it. To share the updated data with others, click “Publish” on the Action Pane.
Step 4: Displaying Reports in Different Currencies
Financial reports can be viewed in any configured reporting currency.
To change the currency, click “Currency” on the Action Pane and select the desired currency. The report will be translated, and any currency codes or symbols will be updated accordingly. Financial reports contain both detail and summary lines. To view only the summary lines, click “Show” and then “Summary lines only.” To view both detail and summary lines, click “Show” and then “Summary lines only” again.
Step 5: Printing and Exporting Reports
To print a financial report, click “Print” on the Action Pane and adjust the print options, such as detail levels, page size, layout, and margins. Click “Print” to generate a PDF file, which you can then print manually.
To export a report to Microsoft Excel, click “Export” on the Action Pane. Your browser will prompt you to open or save the exported file, which will include the export settings defined in the report design.
Next Steps:
If you want to learn more about financial reporting Microsoft Dynamics 365 Finance, contact us here to learn how we can help you grow your business. You can also email us at info@loganconsulting.com or call (312) 345-8817.
Related Posts

Is Your Month-End Close Still Taking Too Long? Five Ways Dynamics 365 Finance Can Help
Posted on: July 29, 2026
Figure 1. A faster close is created by fewer surprises, not faster accountants. Executive takeaway The position: Most organizations do...
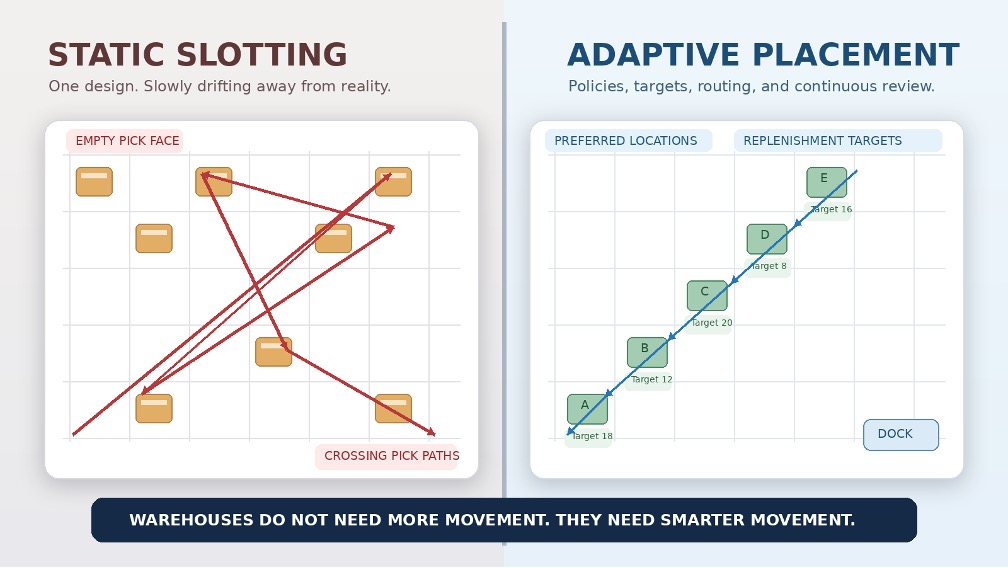
Static Slotting Is Dead: How Dynamic Item Placement Changes Warehouse Execution in D365
Posted on: July 23, 2026
Figure 1. Static placement preserves yesterday's assumptions; adaptive placement governs today's movement. The position: The annual slotting project is no...


