



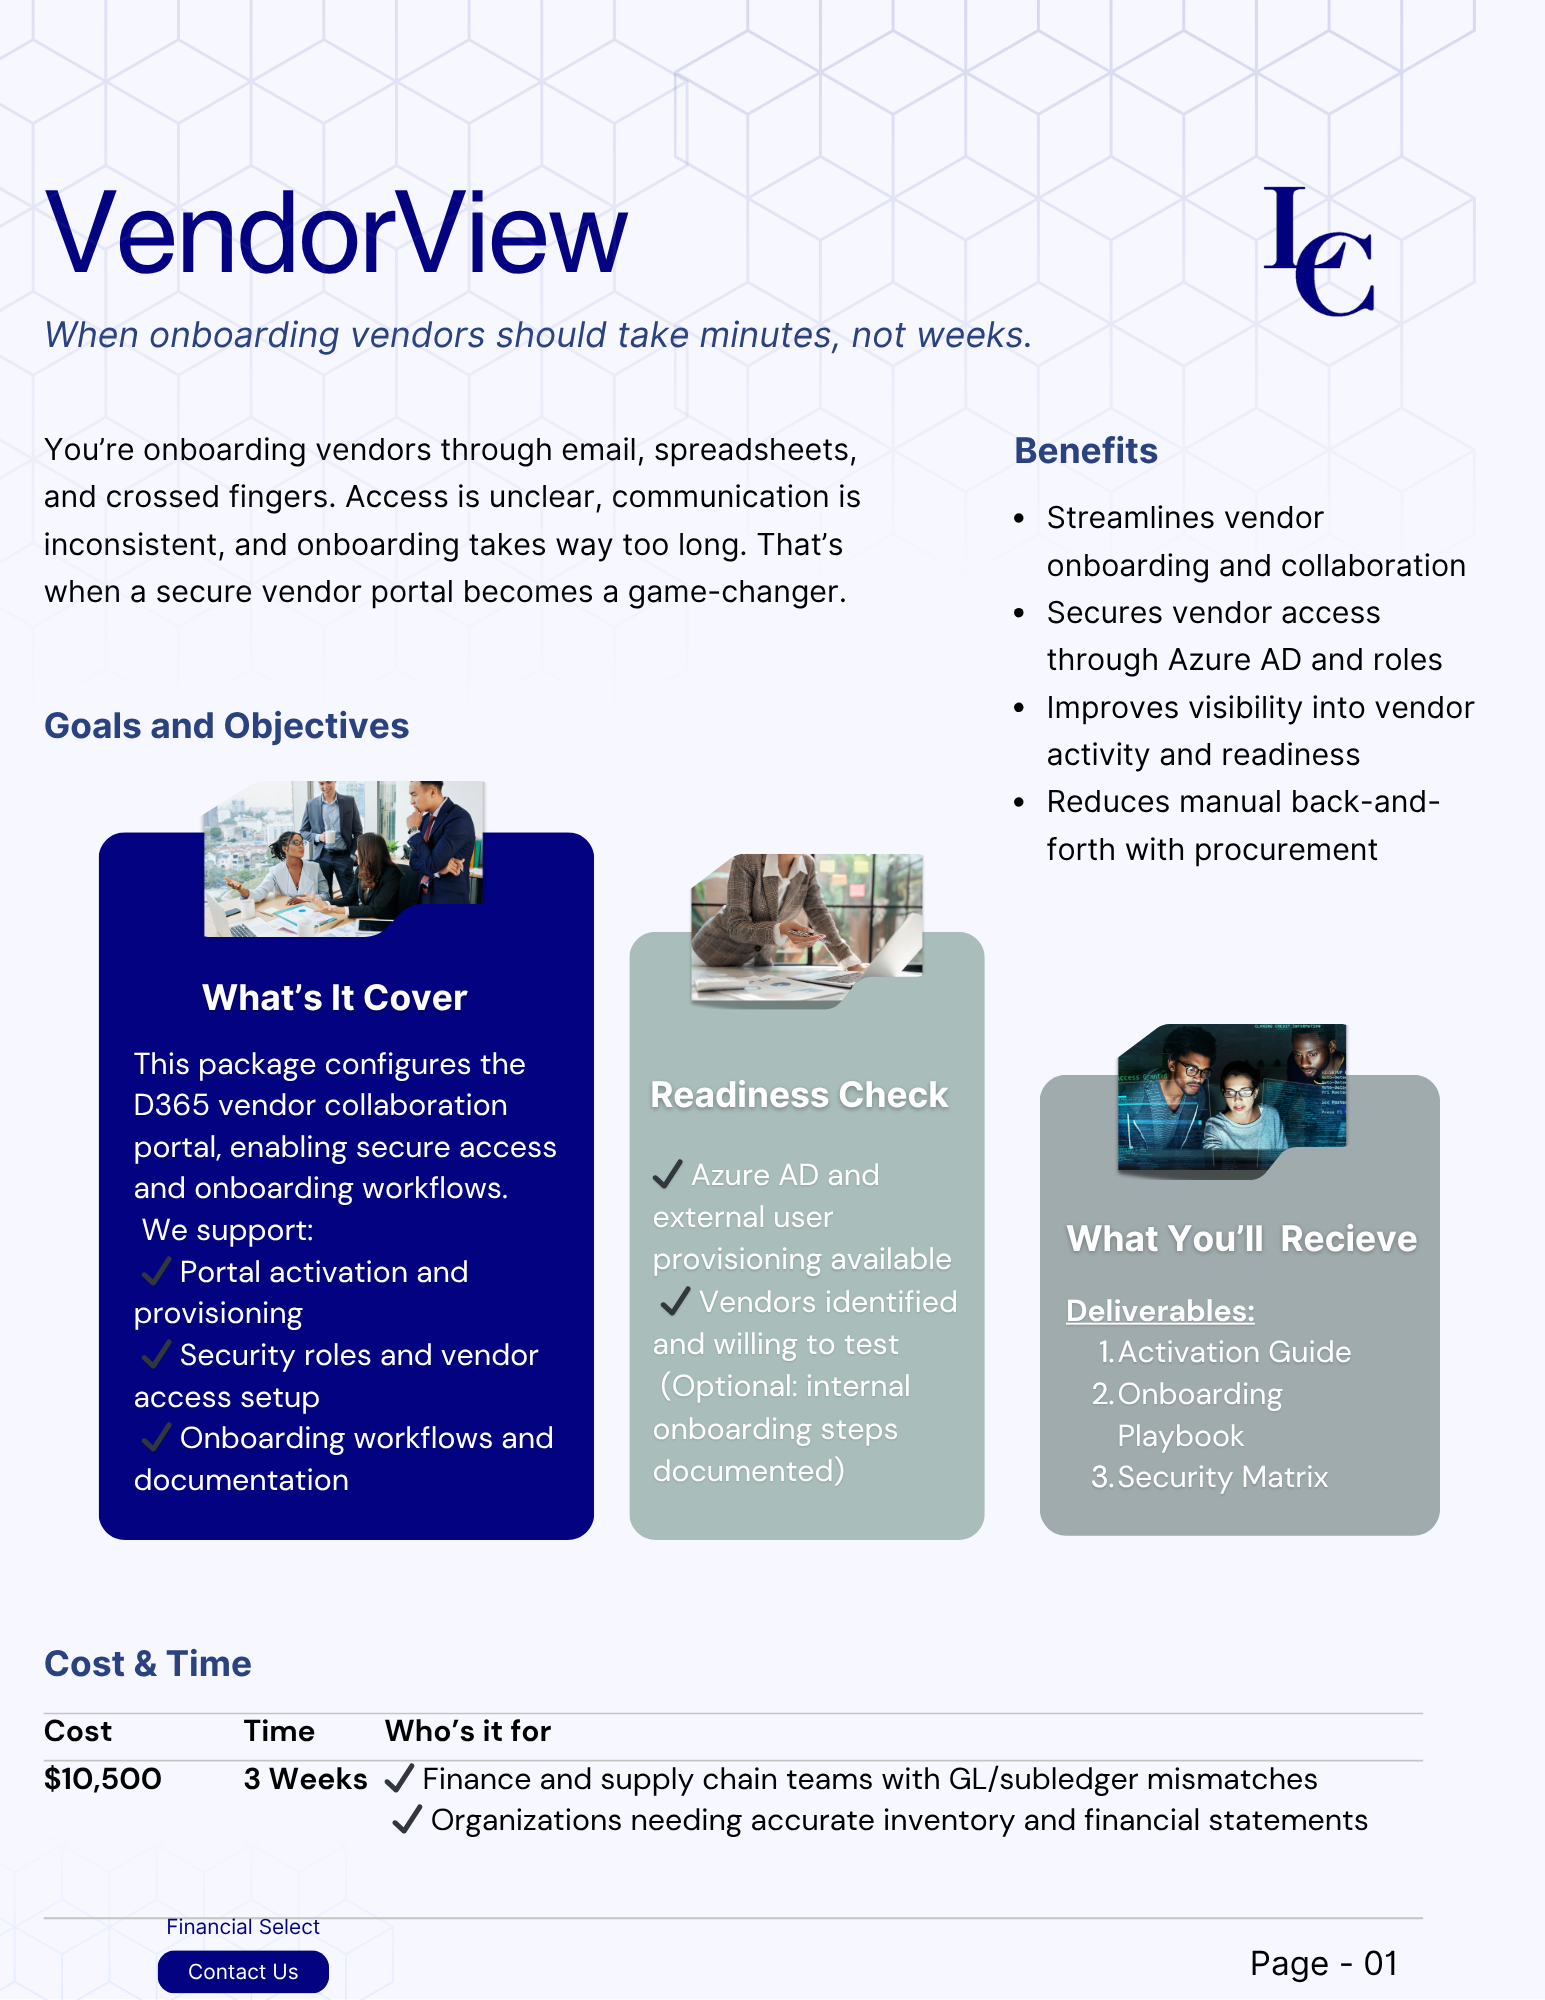


Reviews and corrects ledger-to-subledger alignment in D365 by fixing posting configurations, inventory profiles, reconciliation logic, GL mapping, and critical reporting procedures.
Manage Revenue and Performance with NetSuite Subscription Metrics
Posted on: September 17, 2026 | By: Jackson Morris | NetSuite
Subscription businesses often struggle to answer basic questions about recurring revenue with confidence. Subscription, invoice, and renewal data sits in separate reports, and finance teams rely on manual spreadsheets to calculate ARR, MRR, and churn before leadership meetings. By the time the numbers are reconciled, they may already be out of date.
NetSuite Subscription Metrics turns the recurring revenue data already in NetSuite into interactive dashboards. In this blog, we will cover what the SuiteApp does, how to set it up, and how teams can use it to support forecasting and decision making.

What is NetSuite Subscription Metrics?
Subscription Metrics is a SuiteApp built for software, technology, and other subscription-based organizations running NetSuite. It works alongside NetSuite’s SaaS Metric Reporting feature, which converts subscriptions, invoices, renewals, and related transactions into standardized recurring revenue records. Each change in recurring revenue is classified as new business, an upsell, a downsell, a renewal, or churn, so metrics follow one consistent definition.
The SuiteApp presents that data in three dashboards covering revenue metrics, retention metrics, and unit economics. CFOs, controllers, and revenue leaders can review performance in the same system that already handles billing and receivables.
Setting Up the SuiteApp
Before installation, organizations need NetSuite 2025.2 or later, a OneWorld account, and the SaaS Metric Reporting and Advanced Billing features enabled. Companies reporting in multiple currencies should also enable Multi-Currency and Currency Exchange Rate Type.
An administrator then installs Subscription Metrics from the SuiteApp Marketplace. Initial configuration includes selecting a default exchange rate type and period profile, reviewing KPI formulas, assigning subscription-related fields to item records, and granting role permissions. KPI formulas can be customized to match how the business already defines its metrics.
Accessing and Navigating the Dashboards
After setup, users open the dashboards from the Subscription Metrics menu. By default, they are available in the Accounting, Executive, Sales, and Classic centers. Visibility follows NetSuite role permissions, so users only see the subsidiaries and transactions they can access, with the correct fiscal calendar applied and amounts shown in the lowest common parent company’s base currency.
Enhancements in the 2026.1 release made the dashboards easier to tailor. Users can switch between periods such as the current fiscal year or trailing twelve months, choose ARR or MRR views, and save personal display preferences. Filters, drill-downs to transaction-level detail, and data exports give analysts a clear path from a high-level trend to the records behind it.
Key Metrics in Each Dashboard
The Revenue Metrics dashboard tracks ARR and MRR trends, includes a 12-month forecast, and uses bridge charts to show how new sales, upsells, downsells, and churn moved recurring revenue between periods. This makes it easier to explain growth to executives and board members without rebuilding the analysis each month.
The Retention Metrics dashboard focuses on the existing customer base, including renewal rates, churn, and cohort heatmaps organized by acquisition month. The Unit Economics dashboard evaluates profitability and acquisition efficiency through measures such as customer lifetime value and CAC payback.
NetSuite 2026.2 extended these capabilities with a committed revenue toggle that shifts views from actuals to committed MRR or committed ARR, along with expanded KPI drill-down pages and AI-generated trend summaries. The release also introduced a Customer Subscription Health Score that flags customers at risk of churning within the next 30 or 90 days.
Why it Matters for Forecasting and Decision Making
Recurring revenue metrics are only useful when leaders trust the numbers. Because Subscription Metrics draws directly from billing and subscription records, finance teams spend less time reconciling spreadsheets and more time analyzing what is driving results. A shared set of definitions also keeps finance, sales, and customer success working from the same figures.
Clear visibility into expansion and contraction supports more accurate forecasting. Teams can identify which customer segments are growing, spot early signs of churn, and prioritize renewal outreach before revenue is lost. For organizations already exploring AI in NetSuite, the dashboards pair well with tools like Ask Oracle, which lets users question their data in plain language.
Next Steps
NetSuite Subscription Metrics gives subscription businesses a faster, more reliable way to measure recurring revenue and act on what the data shows. As an Oracle NetSuite Alliance Partner, Logan Consulting helps software and subscription-based organizations confirm prerequisites, configure KPI formulas, and drive dashboard adoption across finance and revenue teams. Contact Logan Consulting today to start turning your recurring revenue data into clearer, more confident forecasts.
 ERP Rescue for NetSuite Implementations: Getting Back on Track
 Extending Your Functionality with the NetSuite SuiteApp Marketplace
 All-In on Insights: Saved Searches for Order Delays and Inventory Management for NetSuite
 From Dock to Delivery: Connecting Warehouse, Production, and Analytics in NetSuite