Dynamics 365 for Finance and Operations- Power BI for ERP End Users
Posted on: November 9, 2018 | By: Jarrod Kraemer | Microsoft Dynamics AX/365
Authored by: Dave Occhionero
In today’s fast paced business world, common words that are popping up in board meetings, and conference rooms across the country are, “Data driven decisions,” “Statistical models”, and “Analytics.” These terms are not only used in business but have practical everyday uses in sports, technology, and in politics as well. When selecting an ERP software, many deciding factors center around how well the ERP can handle statistical analysis.
In many ERP implementations, end users have typically deferred to BI analysts to provide technical expertise when designing and creating reports. An end user will come up with a request, and the request lives in a list that eventually makes its way to the BI team’s queue. With D365, Microsoft has made it easier to equip end users with the tools necessary to build Business Intelligence reports.
Power BI comes in many forms, but one version is an app that lives on your computer and behaves like any other program. When launching the app, you can pull in data from different sources such as Excel, Access, or even the internet. In fact, many users have found data dumps from the internet providing the easiest on hands learning experience. In my first experience with Power BI I used NBA and NFL data to understand the ins and outs of the program.
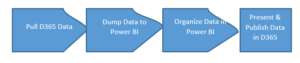
In addition to the app that lives on your computer, you also can retrieve Power BI through your phone, or as an online service. If your company is using D365 in the cloud, there is a good chance that you are viewing Power BI reports within D365 as a graph or chart. This indicates that someone in your company has access to a desktop or web login to Power BI, and has created and published that report to D365. A standard workflow for that report would be: the user who created the report would pull data from D365, collect the data from D365, dump the data into Power BI desktop, massage the data, and then publish the data back to D365.
Once you understand how data flows back and forth between D365 and Power BI, it makes the learning curve of Power BI easier. At its core it is a way to decipher, translate, and present data to individuals or a team. When tasked with coming up with trends or determining analytics, it will all be housed in the Power BI application. The application will contain raw data in tables, that can be converted to visualizations, reports, dashboards, and tiles. Think of all the visualizations that are on a heavy data driven website such as a fivethirtyeight.com. All that data lives as a dataset somewhere and is presented in a user-friendly fashion. Translated in D365, we capture sales orders that go to customers. If we pull that information into D365 in a raw table, convert the sales to a map of the US, and also as a graph that shows sale per state, we now have two visualizations that collectively are called a dashboard. This information can be published back to D365 as a dashboard and can be viewed by management to see sales by region/state. That seems like a simple scenario, but Power BI can be as vague or detailed as you would like.
At first glance or sound Power BI can seem intimidating, but once it is broken down into smaller pieces, it is easy to see how the pieces of ERP and BI come together. In fact, Microsoft has been known to give out free 30-day trials of Power BI. I recommend downloading the application and loading data that is easier for you to translate. You may develop into a reporting specialist!
For additional information around these features please feel free to reach out to us at info@loganconsulting.com or (312) 345-8817.
All the best!
Logan Consulting
www.loganconsulting.com