


Reviews and corrects ledger-to-subledger alignment in D365 by fixing posting configurations, inventory profiles, reconciliation logic, GL mapping, and critical reporting procedures.
Are Your Users Working Inside Dynamics? Use Organization Insights to Find Out
Posted on: September 26, 2017 | By: Jim Bertler | Microsoft Dynamics CRM
Authored by: John Hinchy
In my last blog I wrote about a great Dynamics 365 App called Insights. Well, this week I want to follow that up with writing about another free app called ‘Organization Insights.’ This is actually the first app listed when you navigate to the Dynamics Marketplace or ‘AppSource’ within Dynamics 365. Like ‘Insights’ it is available at no cost for most Dynamics 365 Organizations and is easy and quick to install. Simply navigate to Settings-Dynamics Marketplace, and click on ‘Get it now.’
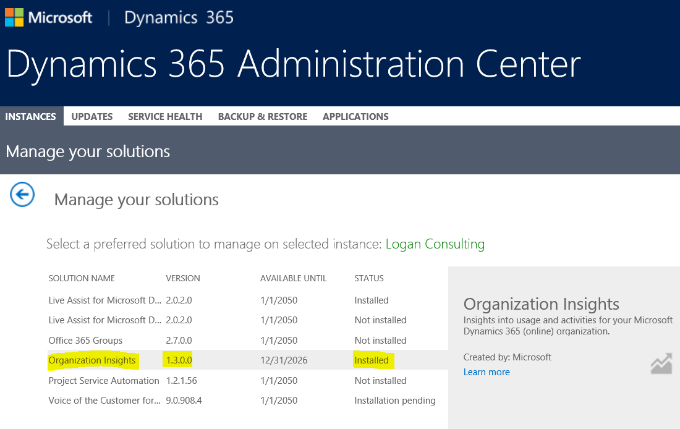
Then in your Admin center you can click Install. After just a few minutes it will be installed and the new icons and functionality will be available immediately within your Dynamics environment.
What the app does, now that it is ready for use, is it gathers all sorts of organizational data and provides it in pre-built reports. Here, organizational data refers to what is happening within your specific Dynamics 365 environment; how many people are logging in, what entities are they looking add, who is adding records or modifying records, how the system is behaving in terms of speed and accuracy, etc.
To start using Organization Insights navigate to Settings, then click the icon for Organization Insights, it will probably be found under the Dynamics App for Outlook icon.

See in the image that the home dashboard is already neatly configured for the user and shows Total Active Users, Total API Calls, API Success Rate, and Plug-in Executions. It also allows you to choose the date range for which you’d like to see statistics for.
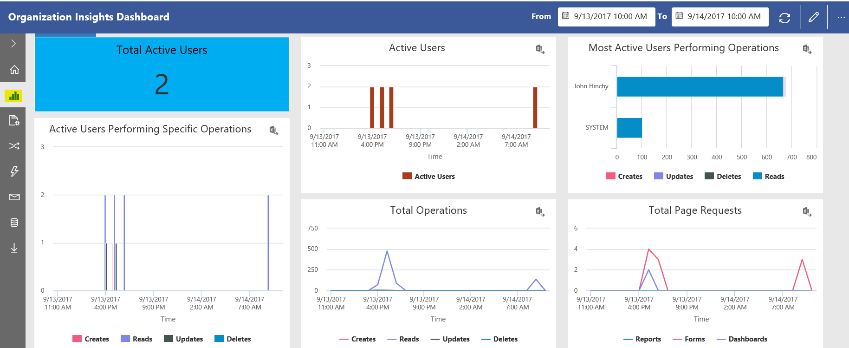
If you click down one dashboard from Home to the Active Usage dashboard, you will gain more user based data as opposed to system based data. This dashboard is extremely helpful for administrators and managers to see who is logging in and actually using Dynamics. The Most Active Users Performing Operations chart within this dashboard will give usage on which users are creating, updating, deleting, or reading data in a bar graph. The information can then be exported directly to excel for further analysis as well.
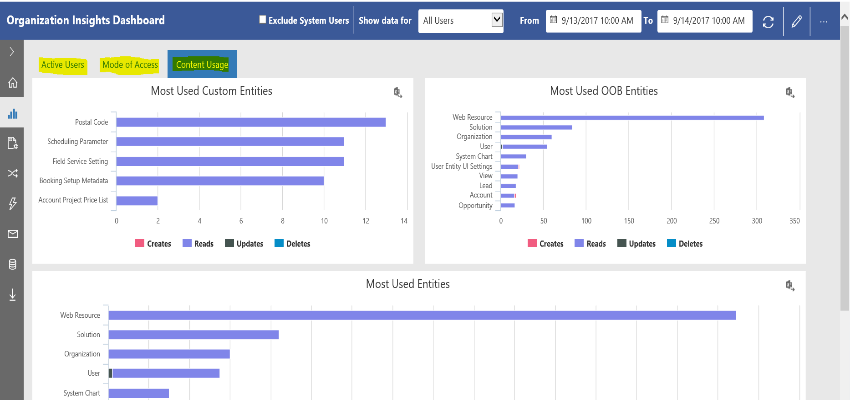
Use the tabs on this usage dashboard to try the Mode of Access screen which shows what devices users are logging in from. Also, see the Content Usage screen to get information on which entities are being used including the most used entities. The app has many other dashboards and features to explore, and with the ease of use and setup, plus the no cost aspect, I highly suggest you try it out.
If you think that a Dynamics CRM system is the next best step for your business, contact Logan Consulting, your Microsoft Dynamics CRM partner of Chicago.


