


Reviews and corrects ledger-to-subledger alignment in D365 by fixing posting configurations, inventory profiles, reconciliation logic, GL mapping, and critical reporting procedures.
New Visualization Features in Intacct
Posted on: November 3, 2014 | By: Guy Logan | Intacct
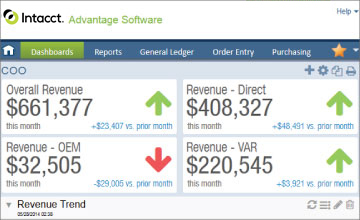
Visualizations of your company’s performance are essential for growth and sometimes there is just not enough time in the day to search for all the numbers that truly matter. Having data at your fingertips can improve performance immensely, making Intacct’s new financial report and graphs addition, Performance Cards, an easy to use and efficient new tool to help picture, interpret and improve workflow in an instant. Performance Cards allow for a quick and intuitive way to see important financial and business metrics and are displayed right on your Intacct dashboard as soon as you log in. Performance Cards allow you to:
- Customize data on your cards to convey performance trends that are essential towards you.
- Understand big ideas in very little time with easy to use visual indicators.
- View information in real time, coming directly from your financial system.
- Improve insight for your whole organization by allowing the ability to monitor short and medium term issues, not just top-level KPIs.
Although a seemingly small feature in the big world of Intacct, performance cards can provide great value towards you and your company. Confident decisions can be made in just a moment’s notice, users can get a better understanding of what drives performance trends and organizations can act quicker to minimize risk, increase growth and make beneficial changes. Not to mention, as a part of your Intacct dashboard, performance cards are incredibly easy to use and require no additional time or effort to put in place.


