Sales and profitability performance Power BI content for Dynamics 365 Finance and SCM
Posted on: April 20, 2022 | By: Guy Logan | Microsoft Dynamics AX/365, Microsoft Dynamics Manufacturing
Having a tool to help you visualize data and statistics can sometimes make the biggest difference. Microsoft Dynamics 365 for Finance and Supply Chain Management allows you to fast-track this visualization with embedded Power BI content, and it’s included in your D365 licensing. For example, if you are a sales manager, you can monitor the key sales metrics of revenue, gross profit, and profit margins using the Sales and Profitability Performance embedded Power BI content. This sales business intelligence uses sales transactional data and provides both an aggregate view of the company-wide sales figures and a breakdown of sales performance for customers and products.
This blog describes what is included in the Sales and profitability performance Microsoft Power BI content. It explains how to access the Power BI reports, and provides information about the data model and entities that are used to build the content
Overview
Reports highlight changes in revenue and profit growth over time. Therefore, the reports can be used to alert managers about positive and negative trends for individual customers and products. Additionally, charts compare the revenue and profitability of different product categories and customer groups to each other. Therefore, category and regional managers can identify laggards and leaders. Finally, a comprehensive report plots an individual customer’s revenue versus profit margin. Therefore, account managers have a data-backed foundation that they can use to tune their sales and marketing efforts to each customer’s profile.
The Sales and profitability performance content lets sales managers analyze sales performance in the following ways:
- Revenue, year-to-date (by customer group and individual customers, sales categories, and individual products and geographies)
- Revenue change, year-over-year (by customer regions and sales categories)
Profitability can be analyzed in these ways:
- Gross profit and profit margin (by customer groups and product sales categories)
- Gross profit change, year-over-year
- Customer profitability (by revenue versus gross margin)
Metrics that are included in the Power BI content
The Sales and profitability performance Power BI content includes a report that consists of a set of metrics. These metrics are visualized as charts, tiles, and tables. The following table provides an overview of the visualizations in the content.

Accessing the Power BI content
The Sales and profitability performance Power BI content is shown on the Sales and profitability performance page (Sales and marketing > Inquiries and reports > Sales performance analysis > Sales and profitability performance).
Next Steps
If you are interested in learning more about sales and profitability performance Power BI content using Microsoft Dynamics 365 for Finance, contact us here to find out how we can help you grow your business. You can also email us at info@loganconsulting.com or call (312) 345-8817.
Related Posts
-
Posted on: June 11, 2026
[embed]https://youtu.be/f8S_rP0a_ig?si=FvTrvIIrKlFKw2cO[/embed] The 2025 release wave 2 for Dynamics 365 Finance covers the new functionality Microsoft delivered to market between October...
Read More ›
-
Posted on: June 9, 2026
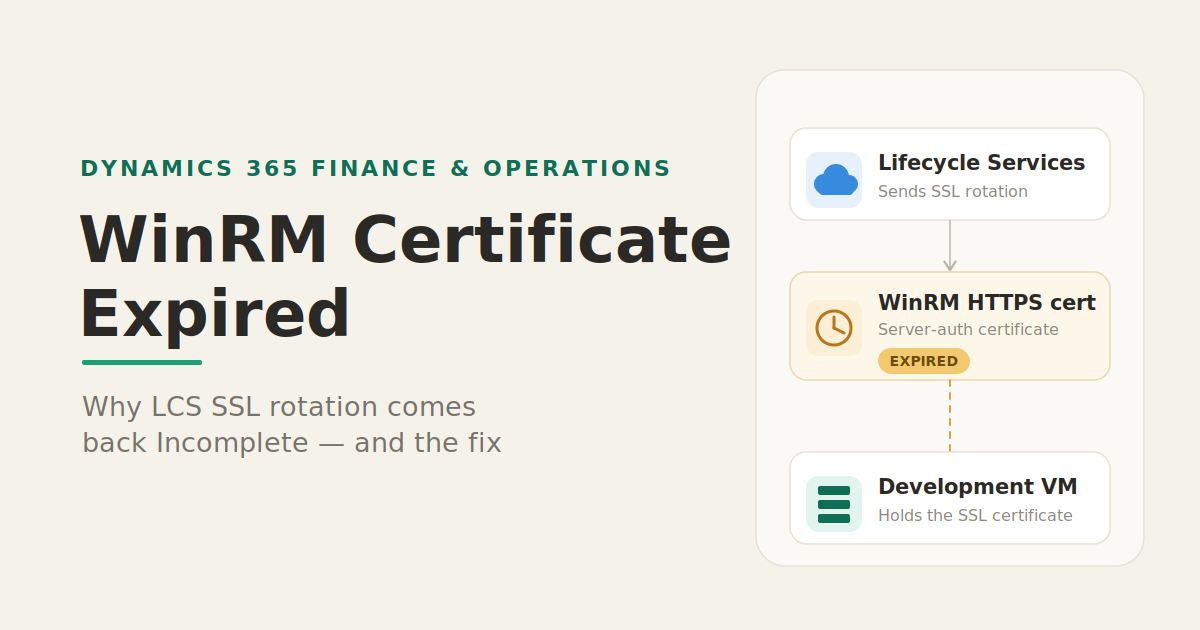
Every so often, a Dynamics 365 Finance & Operations development VM reminds us that certificates are like milk: they expire...
Read More ›