


Reviews and corrects ledger-to-subledger alignment in D365 by fixing posting configurations, inventory profiles, reconciliation logic, GL mapping, and critical reporting procedures.
Maximizing Your Data with Dynamics CRM Power Platform: Part IX
Posted on: February 27, 2025 | By: Page Wildridge | Microsoft Dynamics CRM
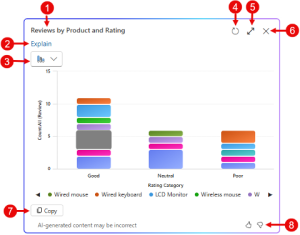
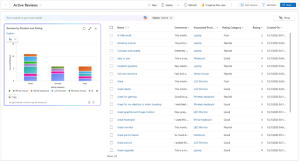
Visualize Data in a View with Copilot
In Episode 8 of our “Maximizing Your Data” series, we explored the benefits of using the Relationship Assistant in Dynamics 365 to improve customer engagement and streamline sales processes. This month, we will focus on how you can leverage Copilot in Power Apps to visualize data in a view, making it easier to understand trends, patterns, and relationships in your data.
Enhanced User Experience
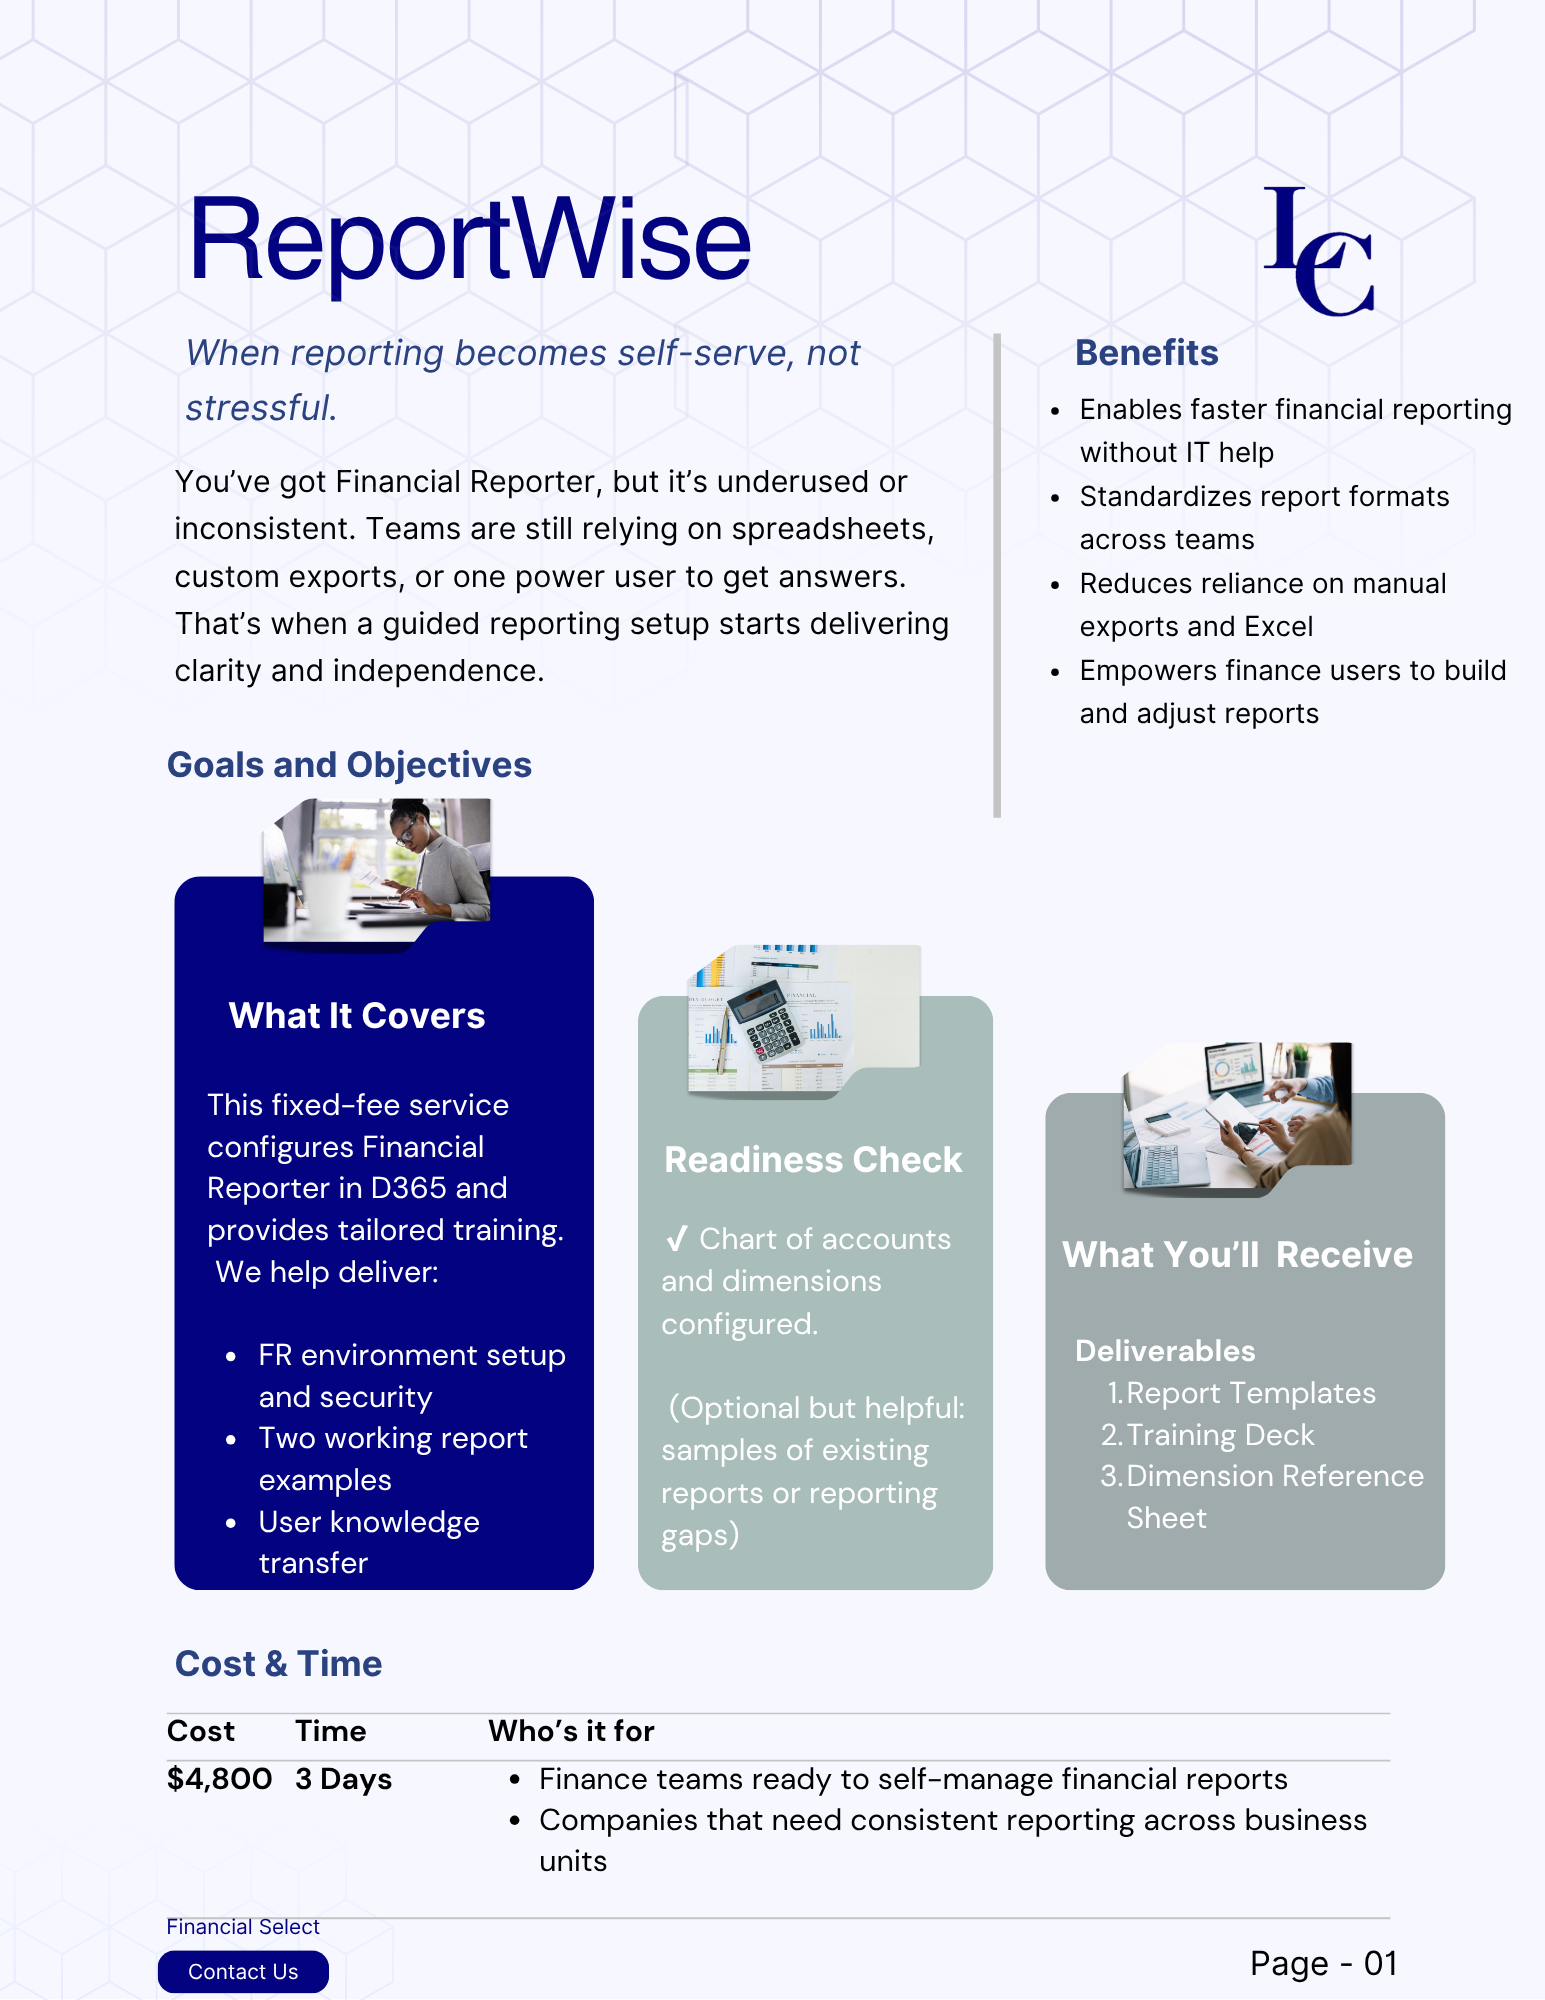
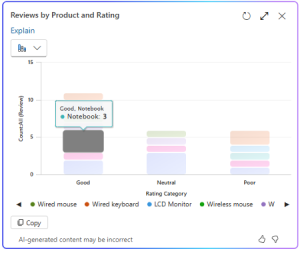
The interactive nature of Copilot’s visualizations significantly enhances user experience. Users can hover over charts to examine data points, select chart elements to drill into the data, and even personalize the charts to suit their needs. This reduces cognitive load and allows users to focus on high-priority tasks, ultimately leading to increased productivity and satisfaction. Furthermore, the ability to customize visualizations ensures that users can tailor their data views to match their specific needs and preferences, making the overall experience more intuitive and user-friendly.
Informed Decision Making
With Copilot, users can make better decisions by leveraging AI-generated insights. For example, Copilot can provide explanations for the visualizations it generates, helping users understand the reasoning behind the data representation. This contextual information is invaluable for making informed decisions and improving business outcomes. Additionally, Copilot’s ability to highlight key data points and trends ensures that users can quickly identify areas that require attention or further analysis.
Practical Applications
- Sales Management: Use Copilot to visualize sales data, track performance, and identify trends.
- Customer Service: Leverage visualizations to monitor customer interactions and case resolutions.
- Data Analysis: Utilize Copilot to analyze large datasets, identify patterns, and generate insights that drive strategic decisions.
Tips for Maximizing Copilot
- Customize Visualizations: Tailor the charts to your specific needs by selecting different chart types and adjusting the visible columns.
- Stay Updated: Regularly update your data to ensure Copilot provides accurate and relevant visualizations.
- Leverage AI Capabilities: Use the AI-generated explanations to gain deeper insights into your data and make more informed decisions.
Next Steps
In this episode, we explored how Copilot in Power Apps can enhance productivity and improve user experience by providing interactive data visualizations. By leveraging this feature, you can stay organized, manage your data more effectively, and make better data-driven decisions. Stay tuned for Episode 10, where we’ll continue to explore innovative strategies to maximize your data capabilities. If you have any questions or would like to learn more, please reach out and schedule time with our team. We hope to speak with you soon!


