


Reviews and corrects ledger-to-subledger alignment in D365 by fixing posting configurations, inventory profiles, reconciliation logic, GL mapping, and critical reporting procedures.
Maximizing Your Data with Dynamics CRM Power Platform: Part VII
Posted on: December 10, 2024 | By: Page Wildridge | Microsoft Dynamics CRM
Enhancing Data Visualization with Charts in Power Apps
In Episode 6 of our “Maximizing Your Data” series, we explored how leveraging AI with the Copilot add-in in Dynamics 365 Sales can transform your sales processes by providing actionable insights, automating routine tasks, and enhancing collaboration. This month, we will explore the benefits of adding charts to forms in D365 and best practices to ensure you get the most out of this feature. Whether you’re looking to improve sales performance tracking, streamline customer service operations, or manage projects more effectively, incorporating charts into your Power Apps forms can significantly enhance your data utilization and decision-making processes.
Improved Data Interpretation:
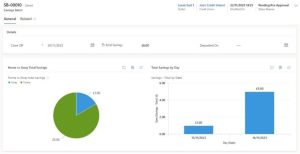
Charts transform raw data into visual insights, making it easier to identify trends, patterns, and outliers. When data is presented in a visual format, it becomes more accessible and understandable, even for those who may not be data experts. For example, a line chart can clearly show sales trends over time, while a bar chart can highlight the performance of different products or services. This improved data interpretation helps users quickly grasp the key points and make informed decisions based on the visualized data.

Enhanced User Experience:
Users can quickly grasp key information without sifting through extensive data tables. Charts provide a more engaging and intuitive way to interact with data, reducing the cognitive load on users. By presenting data visually, charts can highlight important metrics and KPIs at a glance, allowing users to focus on what matters most. This enhanced user experience can lead to increased productivity and satisfaction, as users can find the information they need more efficiently.
Informed Decision-Making:
Visual data aids in faster and more accurate decision-making. When data is presented in a clear and concise manner, it becomes easier to analyze and draw conclusions. Charts can help identify correlations, trends, and anomalies that might not be immediately apparent in raw data. For instance, a pie chart can show the distribution of customer segments, helping marketing teams tailor their strategies accordingly. By providing a visual summary of data, charts enable decision-makers to quickly assess the situation and take appropriate actions based on the insights gained.
Practical Applications:
- Sales Performance: Visualize sales data to track performance against targets, identify top-performing products, and monitor sales trends over time.
- Customer Service: Use charts to display metrics like case resolution times, customer satisfaction scores, and the volume of support requests.
- Project Management: Track project progress, resource allocation, and task completion rates with visual dashboards.
Best Practices for Using Charts
- Choose the Right Chart Type: Select a chart type that best represents your data. For example, use line charts for trends over time and pie charts for parts of a whole.
- Keep It Simple: Avoid cluttering your charts with too much information. Focus on key metrics that provide the most value to your users.
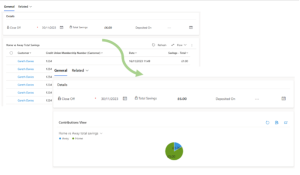
- Make It Interactive: Enable features that allow users to interact with the chart, such as filtering data or switching between different views.
Next Steps
In this episode, we explored how adding charts to forms in Power Apps is a powerful way to enhance data visualization and improve user experience. By leveraging this feature, you can create dynamic, interactive charts that help users make better data-driven decisions. Stay tuned for Episode 8, where we’ll continue to explore innovative strategies to maximize your data capabilities. If you have any questions or would like to learn more, please reach out and schedule time with our team. We hope to speak with you soon!


