Budget vs. Actuals: Using Power BI + Microsoft D365 Finance for Project Insight
Posted on: January 12, 2026 | By: Ashley Xue | Microsoft Dynamics AX/365
Because “we’re probably fine” is not a project control strategy.
If you’ve ever sat through a project review where the conversation goes like this…
-
PM: “We’re tracking okay.”
-
Finance: “Actuals are higher than expected.”
-
Ops: “That invoice shouldn’t have hit the project.”
-
Exec: “So… are we on budget or not?”
-
Everyone: stares at three spreadsheets with different answers
You already know the problem: budget vs. actuals is rarely one number. It’s a story—and the story lives across cost types, timing, commitments, billing status, and scope changes.
The good news: Microsoft D365 Finance already has the backbone of project financial truth, and Power BI is built to turn that truth into insight—fast. The trick is designing it like a project control system, not just a report.
Below is a practical, market-ready approach we use at Logan Consulting to help teams move from “variance reporting” to variance intelligence.
Why budget vs. actuals breaks down in real life
Most organizations think they have a budget vs. actuals issue. What they actually have is a definition and timing issue.
Here are the usual culprits:
1) Budget versions aren’t treated like versions
Budgets change (scope changes, phasing changes, resourcing changes). If your Power BI model treats “the budget” as one static table, you’ll end up arguing about which budget is “real.”
Fix: treat budgets as versioned snapshots with effective dates and approval status.
2) Actuals are posted… but not explained
D365 Finance captures actuals well—project transactions, vendor invoices, ledger postings—but stakeholders still ask:
Fix: build a model that ties actuals to project structure (project/task/category/resource/vendor) and supports driver-based variance.
3) Commitments are invisible until it’s too late
If you only compare budget vs posted actuals, you’ll discover overages after the PO is already issued and the invoice hits.
Fix: include committed cost (e.g., open POs, approved time, pending vendor invoices where applicable) alongside actuals.
4) Timing makes honest teams look bad
Monthly reviews punish teams for timing differences:
Fix: show both:
prove value, then move to B or C once leadership says, “We want this for every project, every week.”
The goal: one conversation, one screen, one source of truth
When budget vs. actuals is working well, your project review meeting changes from: “Which number is correct?” to “What action are we taking this week?” That’s what Power BI + D365 Finance can enable when you design the solution around decision-making.

What to pull from D365 Finance (the “minimum viable model”)
You don’t need every table under the sun. You need the few that tell the financial story end-to-end. Think in facts and dimensions:
Fact tables you typically need
-
Budget (by project/task/category/time period, with versioning)
-
Actuals (posted project transactions and/or ledger-based postings tied to projects)
-
Commitments (open POs, open subcontracts, other committed costs depending on your operating model)
-
Forecast / Estimate at Completion (EAC) if you use it (even if it starts as a lightweight “latest estimate”)
Dimensions that make analysis useful (and fast)
-
Project (and project hierarchy)
-
Task / WBS (if you use it)
-
Category (cost categories, revenue categories)
-
Resource / worker (for labor-heavy projects)
-
Vendor (for subcontract-heavy projects)
-
Legal entity / company
-
Date (fiscal calendar)
-
Currency (and exchange rate logic if you run multi-currency projects)
Logan POV: The magic is not extracting data—it’s standardizing the grain (the “level” of detail) so budget, actuals, and commitments can be compared without gymnastics.
Integration patterns: 3 common ways to feed Power BI from D365 Finance
There isn’t one “right” architecture. There is a right architecture for your latency, volume, and governance needs.
Pattern A: Direct reporting (fastest to start)
Watch-outs: performance, refresh limits, and the tendency to “report directly on operational tables” without a stable semantic layer.
Pattern B: Data lake / curated layer (best for scale)
-
Export/replicate D365 Finance data into a lake/warehouse
-
Build a curated star schema for Power BI
-
Enables broader analytics (cross-system, historical snapshots, richer calculations)
Watch-outs: requires stronger data engineering and governance, but pays off quickly once multiple teams rely on the model.
Pattern C: BYOD / staging database (pragmatic middle ground)
Watch-outs: make sure you define ownership (IT vs Finance vs PMO) and don’t let “temporary staging” become your forever architecture.
Logan POV: Most clients start with A to prove value, then move to B or C once leadership says, “We want this for every project, every week.”
Designing the Power BI experience: stop showing numbers, start showing decisions
A great budget vs. actuals dashboard answers three questions in order:
1) What happened?
-
Budget, Actuals, Variance ($ and %), Burn rate, Budget consumed %
2) Why did it happen?
-
Variance by category (labor, materials, subcontract, expense), Variance by task/WBS, Variance by vendor/resource, Top drivers (the “80/20” view)
3) What’s likely to happen next?
-
Committed cost, Forecast/EAC vs budget, “If nothing changes” projection based on burn rate, Risks/opportunities (even if captured as a simple flag/commentary at first)
Visuals that consistently work (and executives actually use)

-
Variance waterfall (budget → actuals, plus main drivers)
-
Trend line for actuals vs budget phasing (are we front-loading spend?)
-
Matrix by project/task/category with drill-through to transaction detail
-
Top drivers list (biggest variances, newest changes since last refresh)
-
Committed + actual vs budget bar to show “true exposure”
Small but powerful feature: an “As of date” slicer with a refresh timestamp. If people don’t trust freshness, they won’t trust anything else.
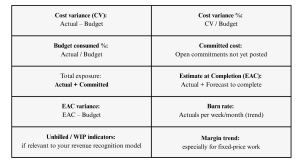
The KPI set that makes project reviews 10x sharper
If you’re building this capability, here are high-impact metrics to include:
And a practical “PM question set” your dashboard should answer in under 30 seconds:
Are we over or under budget? | Is this a timing issue or a true overrun? | Which category is driving the variance?
Which vendor/resource/task is driving it? | When did the variance start? | What’s committed but not posted yet?
What will the project likely cost at completion? | Is the forecast improving or deteriorating?
Are we billing fast enough to match spend? | What needs a decision this week?
Common traps (and how to avoid them)
Trap: treating “Actuals” as one universal definition
Some teams mean posted costs. Others mean approved time. Others mean incurred cost including accruals.
Avoid it: label measures clearly (Posted Actuals vs Approved Costs vs Exposure) and align definitions with Finance + PMO.
Trap: not handling multi-currency properly
If budgets are in one currency and actuals in another, variance becomes nonsense without a policy.
Avoid it: decide early whether reporting is in:
-
project currency,
-
company accounting currency, or
-
a reporting currency,
and consistently apply exchange rate logic.
Trap: no version control for budgets
If a budget changes mid-stream and your model overwrites history, you lose the narrative.
Avoid it: capture budget versions and show variance against:
-
original budget
-
current approved budget
-
latest forecast (EAC)
Trap: “One report to rule them all”
Executives want outcomes. PMs want drivers. Finance wants auditability.
Avoid it: build one shared semantic model, then deliver role-based views with security and curated pages.
Budget vs. Actuals in Manufacturing: Project Insight with Power BI + Dynamics 365 F&SCM
Manufacturers run projects constantly, even if you do not call them “projects.”
-
New production line installs
-
Tooling and fixture builds
-
Plant shutdown work
-
Warehouse expansions
-
Engineering change rollouts
-
New product introductions
And they all have the same financial trap: you find out you missed budget after the money is already spent. Dynamics 365 Finance and Supply Chain Management (D365 F&SCM) already has the data to prevent that. Power BI is how you turn that data into fast, repeatable decisions.
The goal is simple: one version of the truth and one screen that answers, “Are we still in control?”
Why budget vs. actuals gets messy on the shop floor
In manufacturing, overruns rarely show up as one obvious line item. They hide in real-world details:
So when someone asks, “Are we on budget?” the real question is usually: “Are we on budget, and what is coming next that will push us over?”
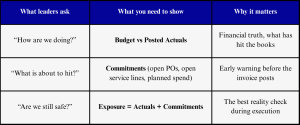
That is why manufacturing teams need three numbers, not one.
The 3 numbers that change the conversation
If your reporting only shows posted actuals, you are driving using the rearview mirror.
What to pull from D365 F&SCM for manufacturing project controls
You do not need everything. You need the pieces that tell the full cost story from plan to purchase to posting.
Core facts (what happened and what is pending):
-
Budget by project, task, category, and time period (with budget versions)
-
Actuals (posted costs and revenues tied to projects and the ledger)
-
Commitments (open purchase orders and other committed costs, based on your process)
-
Forecast/EAC (even a lightweight “latest estimate” is a big step forward)
Core dimensions (how manufacturing teams actually ask questions):
-
Project and WBS or task structure
-
Cost category (labor, materials, subcontract, freight, tooling)
-
Vendor (critical for subcontracting and services)
-
Site, warehouse, and legal entity (for multi-plant visibility)
-
Date and fiscal period
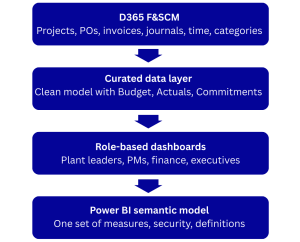
A simple architecture that scales
Logan POV: Most manufacturers start with a quick win on one project, then standardize the model and scale it across plants.
Where Logan Consulting helps
Tools are not the blocker. Alignment is.
Logan Consulting helps manufacturers and D365 F&SCM teams:
-
standardize definitions of actuals, commitments, exposure, and forecast
-
design a scalable data model that supports projects across plants
-
build Power BI dashboards that drive action, not debates
-
enable governance so the numbers stay trusted month after month
If your project reviews still involve spreadsheet reconciliation and “Which number is right?”, that is the sign you are ready for a Budget vs Actuals model built for manufacturing execution.
If you want, we can share a proven starter dashboard blueprint and the KPI definitions we use to get buy-in from plant leadership, finance, and project owners fast.
Next steps:
Related Posts
-
Posted on: January 28, 2026
A Logan Consulting POV on synchronizing inventory, production, and quality — for today’s distributed manufacturers In the modern supply chain,...
Read More ›
-
Posted on: January 26, 2026
As supply chains grow more digital and interconnected, EDI security in 2026 has moved far beyond basic transport encryption. For...
Read More ›